R. Sumi Matsumoto
MSLIS Portfolio, Class of 2021
Analysis of the Comic Book Industry
Project Summary
This project works with comic book sales data. Web scraping from The Mayo Report, I compiled 17 years worth of data into a single CSV file. Using this data I was able to calculate statistics like the estimated revenue generated by each series, the top reordered items, and the number of new issues released by each publisher annually. Using Tableau, I created data visualizations of these sales trends. Additionally, I isolated sales data for Marvel Comics and used the Marvel API to gather more detailed information about each issue, such as the characters featured and the creative team. Finally, I published the records pulled from the Marvel API to Twitter.
Data Set
The data used in this project was web scraped from The Mayo Report. This report was compiled using information from Diamond Comic Distributors, Inc., The Comic Chronicles, and ICv2. The Mayo Report has been published every month since March 2003 through October 2020, with the exception of April - July 2020 when there were industry-wide shut downs due to the COVID-19 pandemic. For this project I have only used data from March 2003 to March 2020, as the most recent months have less accurate and complete data sets (most likely due to changes caused by the pandemic, like DC Comics changing distributors). I also only looked at single issue comics ("floppies")--as opposed to trade paperbacks and hard cover collections.
Method
Using Beautiful Soup, I scraped all of the information from each month off of the Mayo Report website. Each month publishes data on approximately 500 comics. Some of the data had to be slightly edited upon ingest for better handling later on. This included removing the "$" from prices as well as commas from large numbers. I saved the data into a CSV file, copying over 100,000 rows of information. From my giant, aggregated CSV file, I used Python to isolate, aggregate, and calulate the particular pieces of data I wanted to focus on. I saved each of these tracked items into their own CSV file. Finally, I used Tableau to turn my CSV files into data visualizations.
For the second half of my project, I used the aggregated CSV file in tandem with the Marvel API. I found the top selling issues released by Marvel: each month's overall top selling Marvel comic, top selling Marvel first issue, top reordered Marvel comic, and Marvel comic with the highest "delta" (increase in sales between the current and previous issue in a series). I saved this data to an Excel file using openpyxl, with multiple worksheets to differentiate between months and years. I then pulled the record for each issue from the Marvel API and saved each one as a separate JSON file. From my saved API records, I used glob to calculate statistics such as the most featured character. Finally, I wrote a Python script to select a random "top" comic from any year and the current month. The chosen comic was then published to Twitter using Tweepy. All project Python files can be found on the GitHub repository.
Project Findings
While Marvel Comics and DC Comics dominate the industry, there are hundreds of small and indie publishers. For my data visualizations, I chose to only display the top 20 publishers or series. The full Tableau workbook of visualizations can be viewed here.
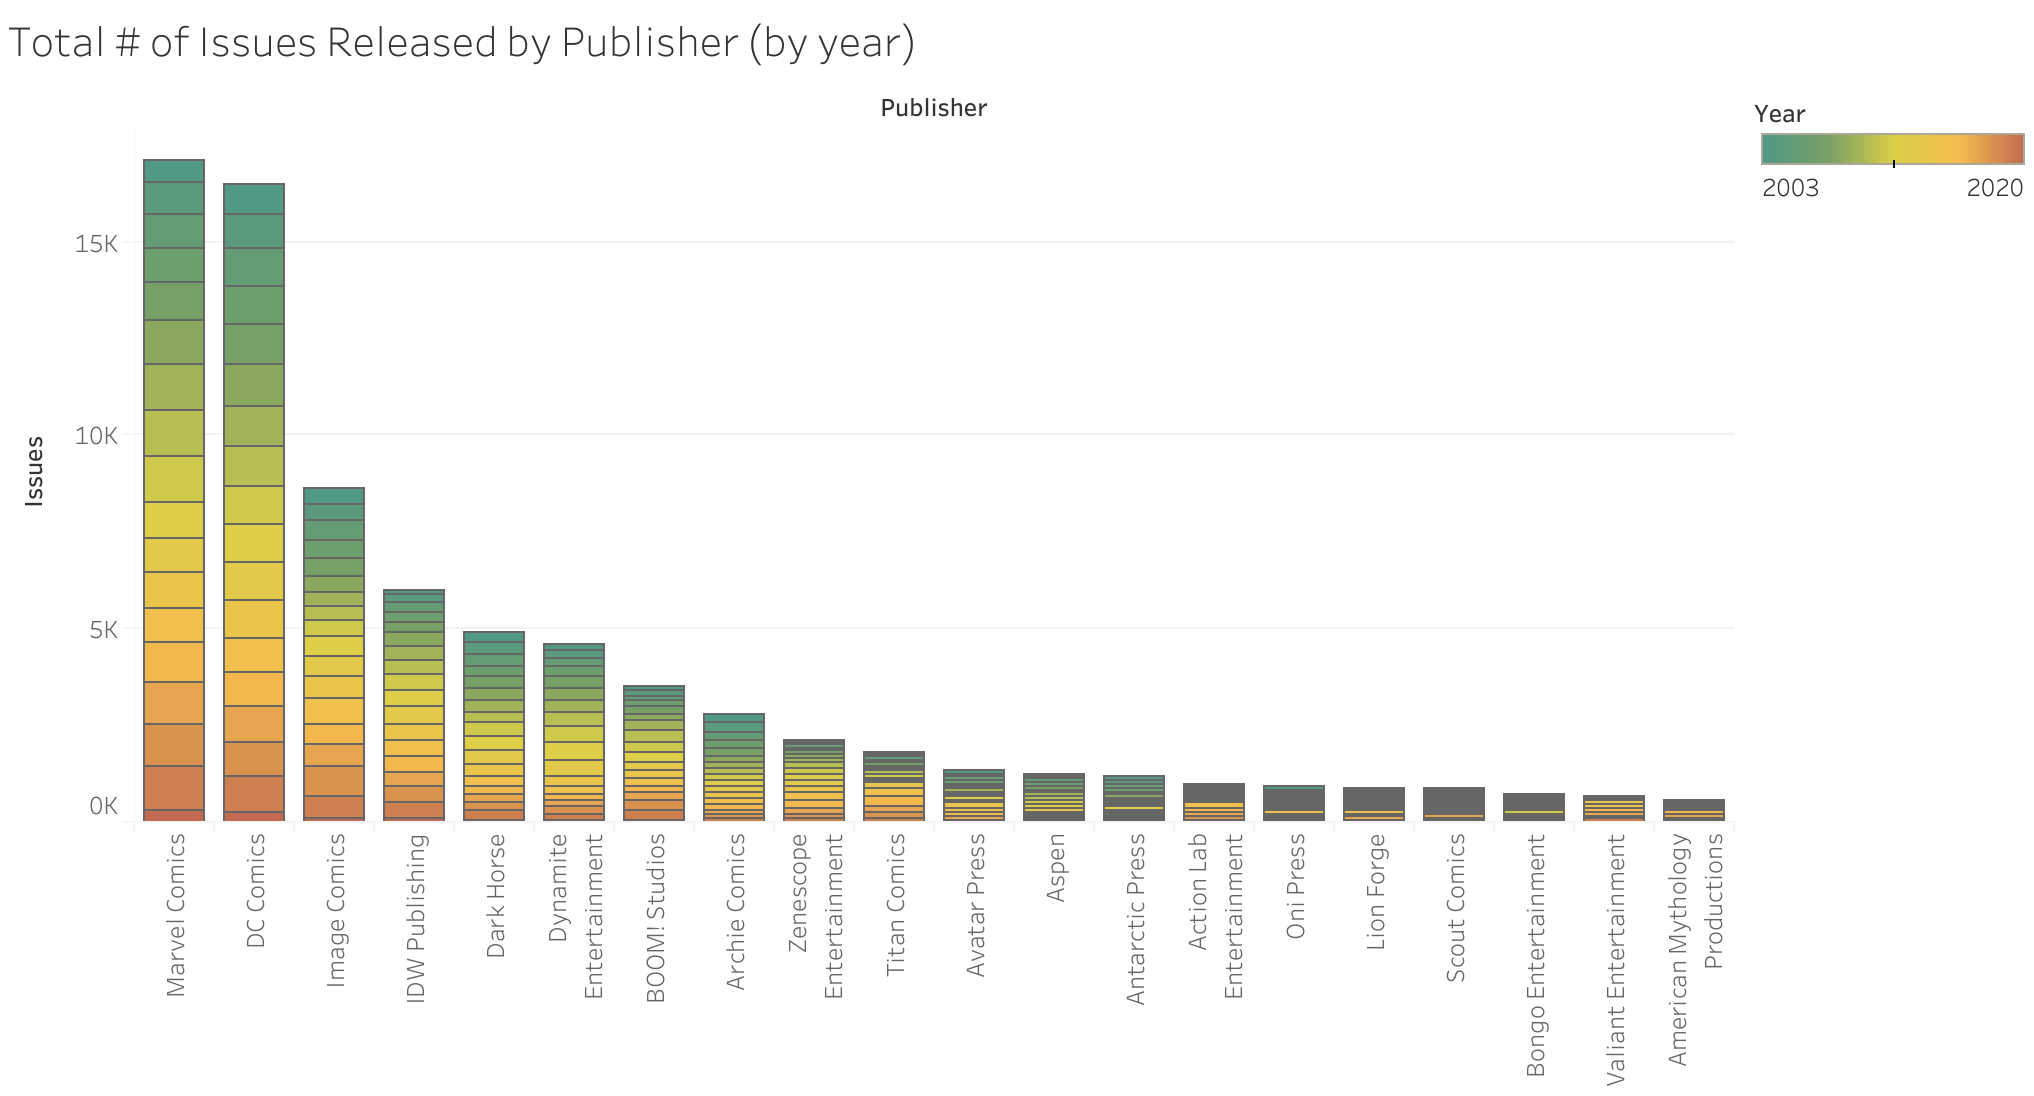
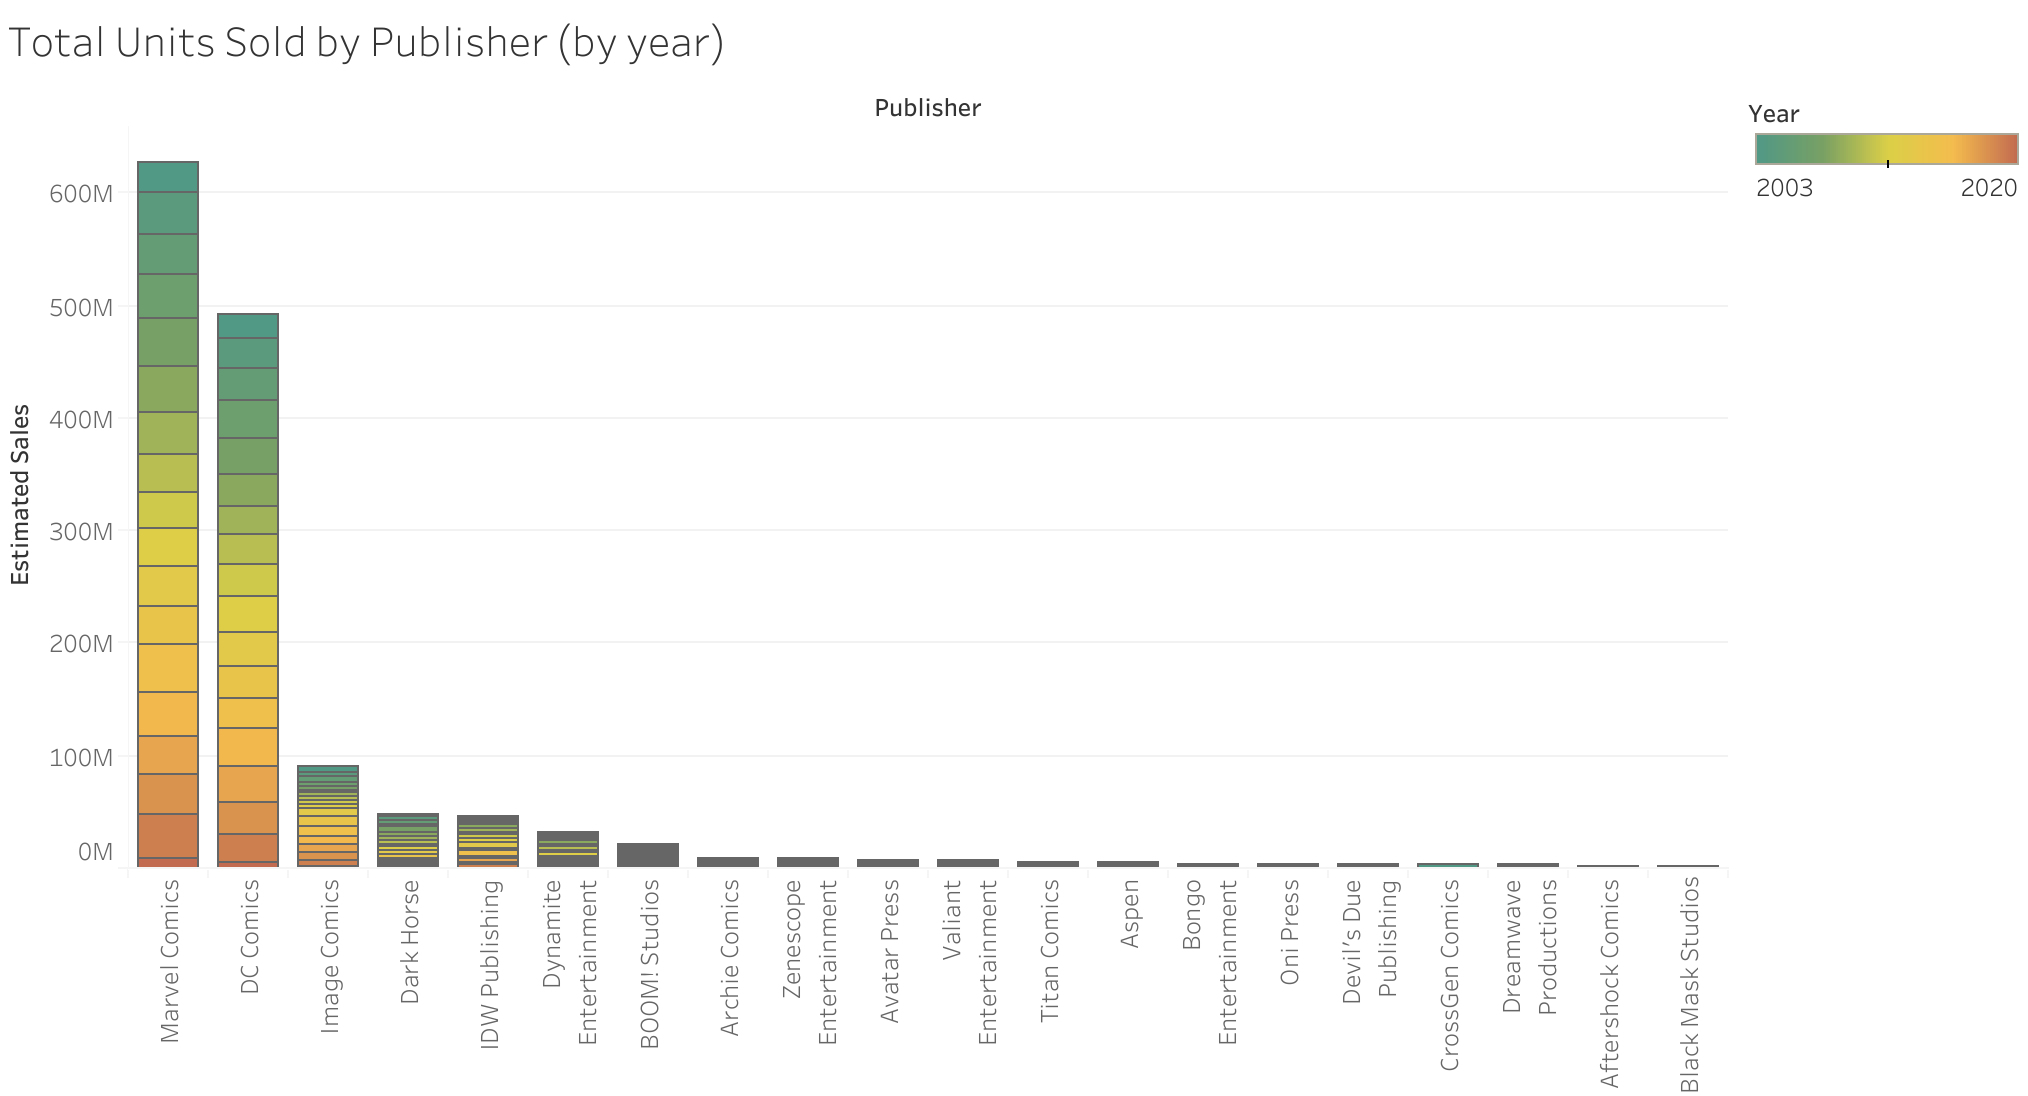
I started by looking at publisher data across the whole data set. There was little difference between the proportion of total units sold and total revenue generated between publishers. This shows that special issues (annuals, et cetera that cost more per issue) have little impact in the overall market. However, while Marvel Comics is by far ahead of all other publishers, Marvel Comics only barely releases more issues than DC Comics. The gap between the "Big 2" (Marvel Comics & DC Comics) and all other publishers is also far less in the total number of issues released. This means that Marvel's domination of the market share is partially due to sheer number of comics released, but can also be attributed to better sales numbers overall.
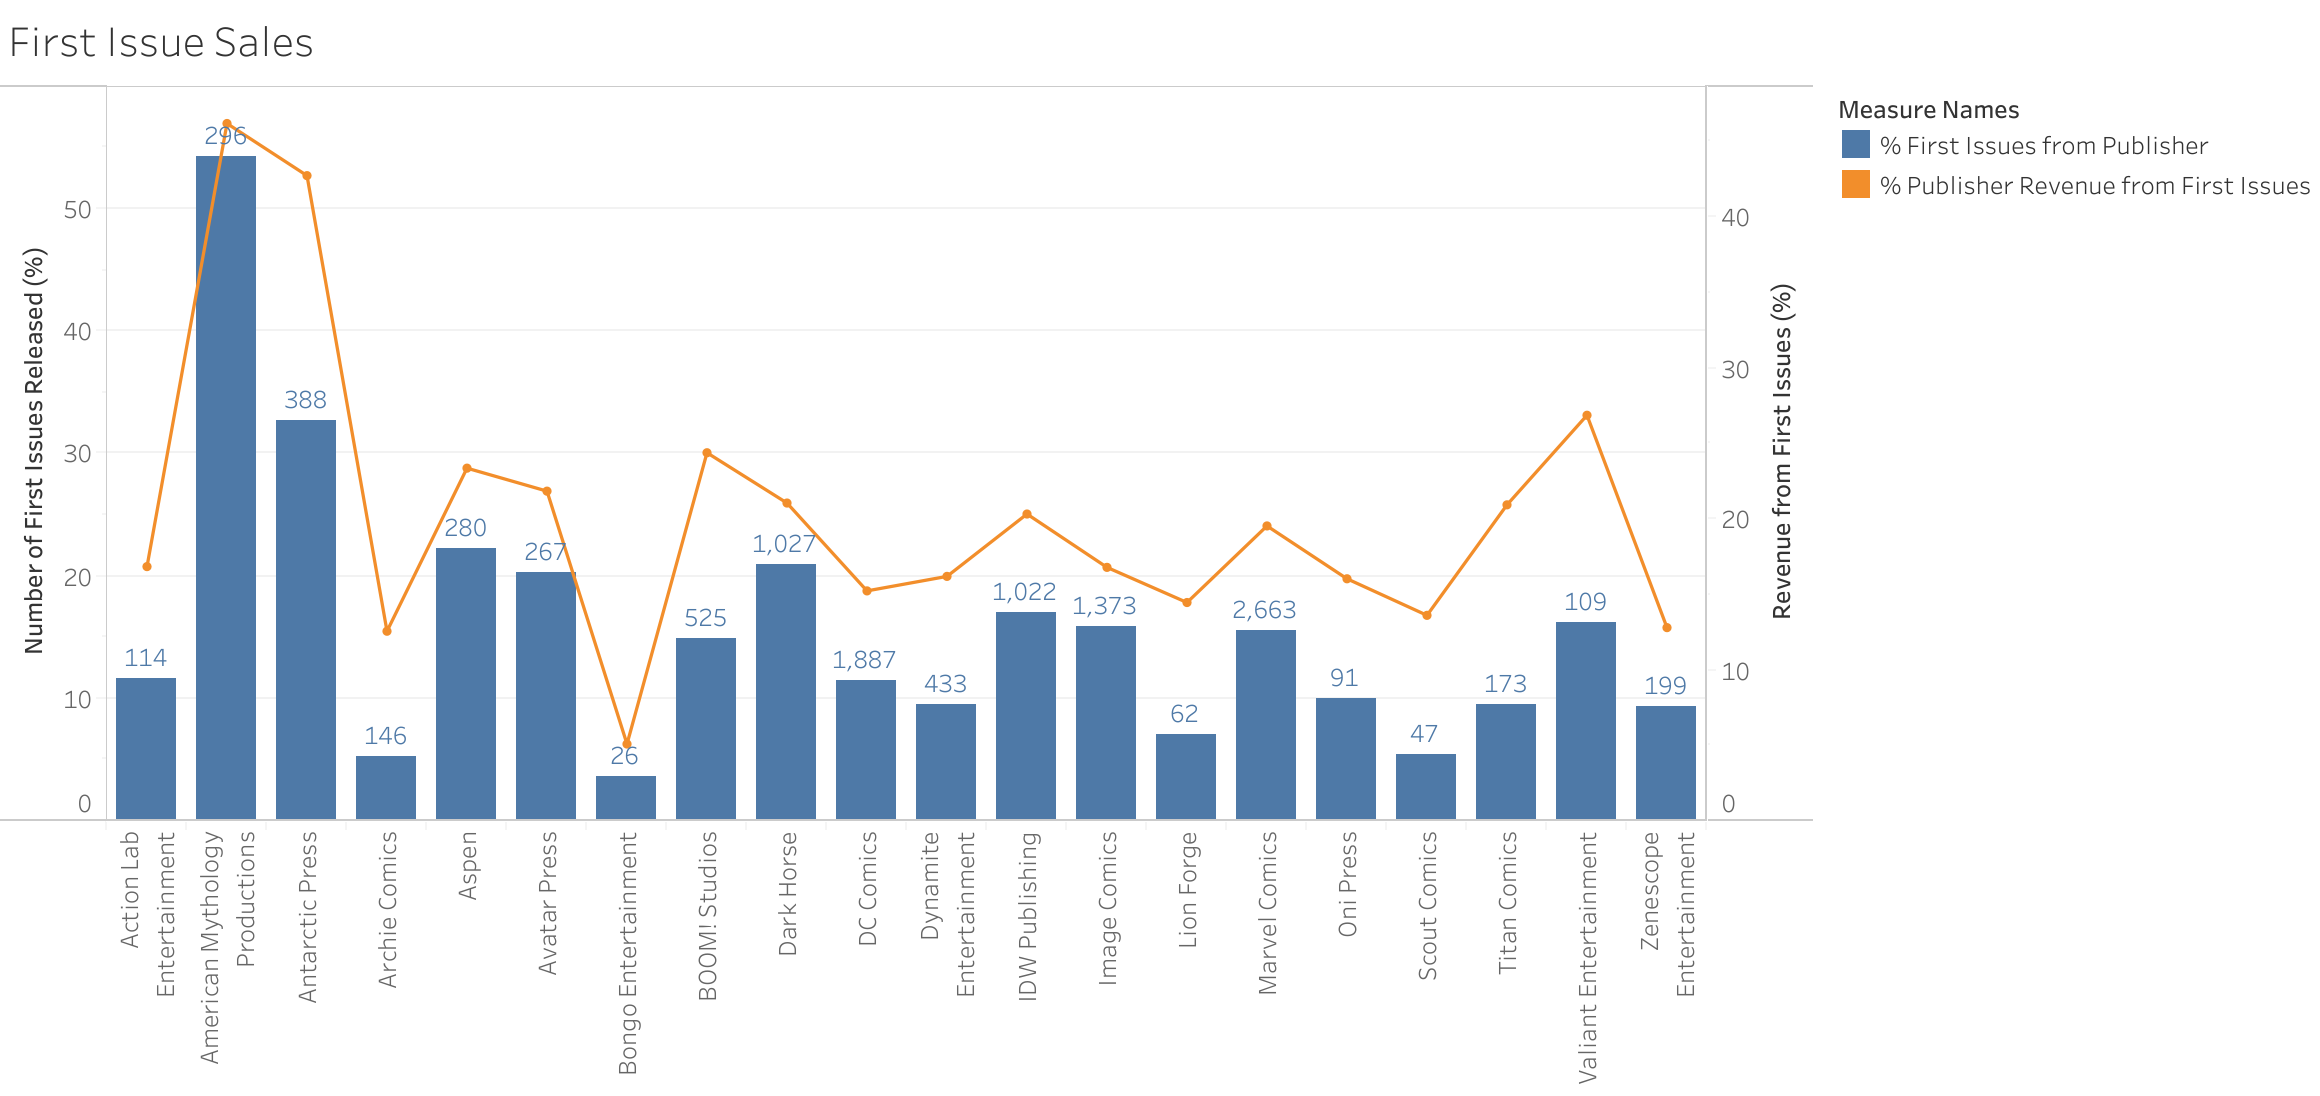
Readership of any series tends to slowly decline over time. This means that the first issue of a series often has the highest readership (and sales). I was curious if the large gap in revenue stems from the "Big 2" (and specifically Marvel Comics) releasing more first issues than other publishers. Only about 15.5% of Marvel Comics' released comics are first issues. Only about 11.5% of DC Comics' released comics are first issues. While the above graph shows that a few small publishers significantly more first issues, for the most part the top publishers all fall into the 10-20% range. Looking at the numbers however, Marvel Comics released a total of 2,663 first issues. DC Comics only released 1,887. Surprisingly the top indie publishers (Image Comics, Dark Horse, and IDW Publishing) all have released over 1,000 first issues--not too far behind DC Comics.
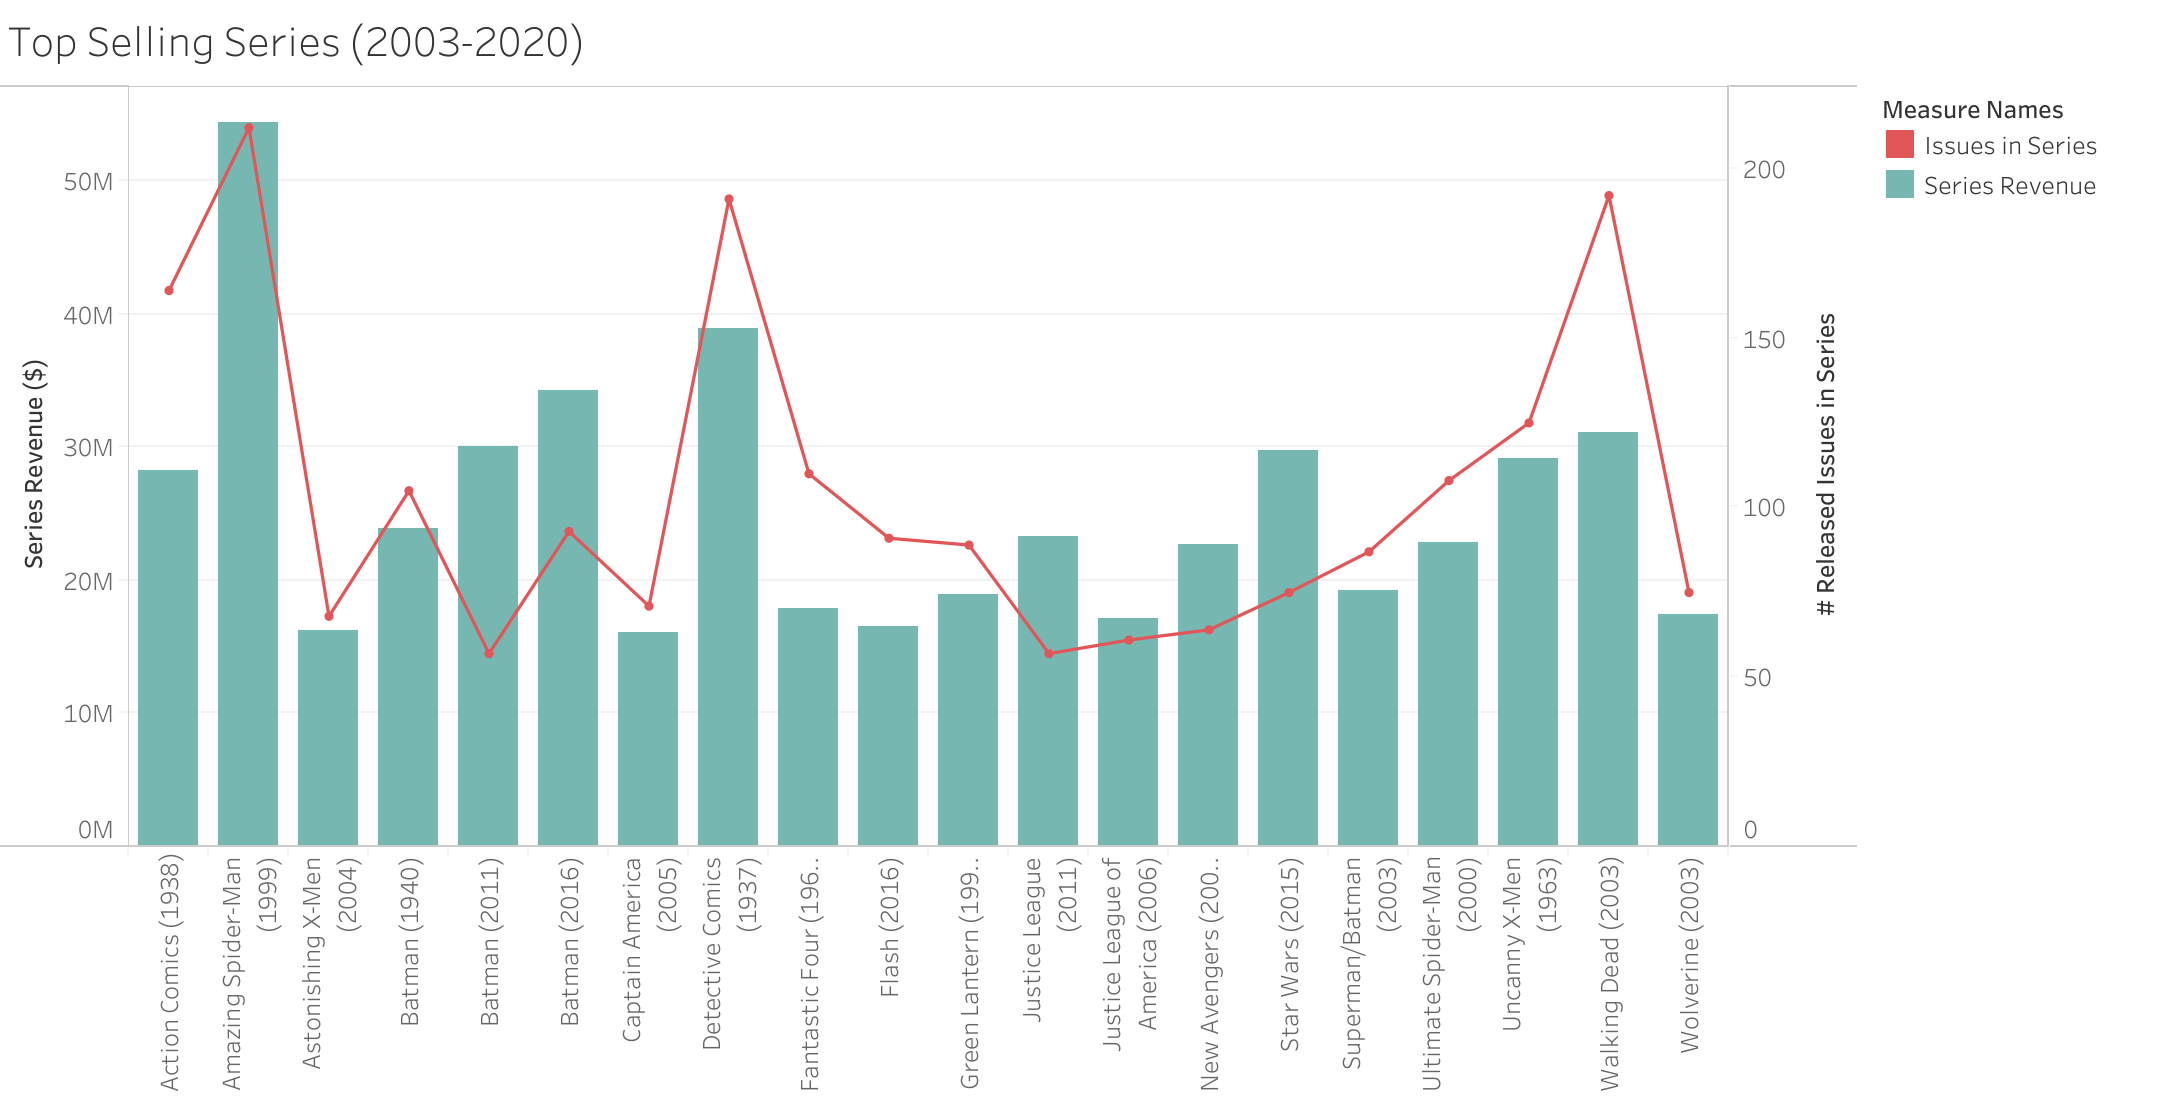
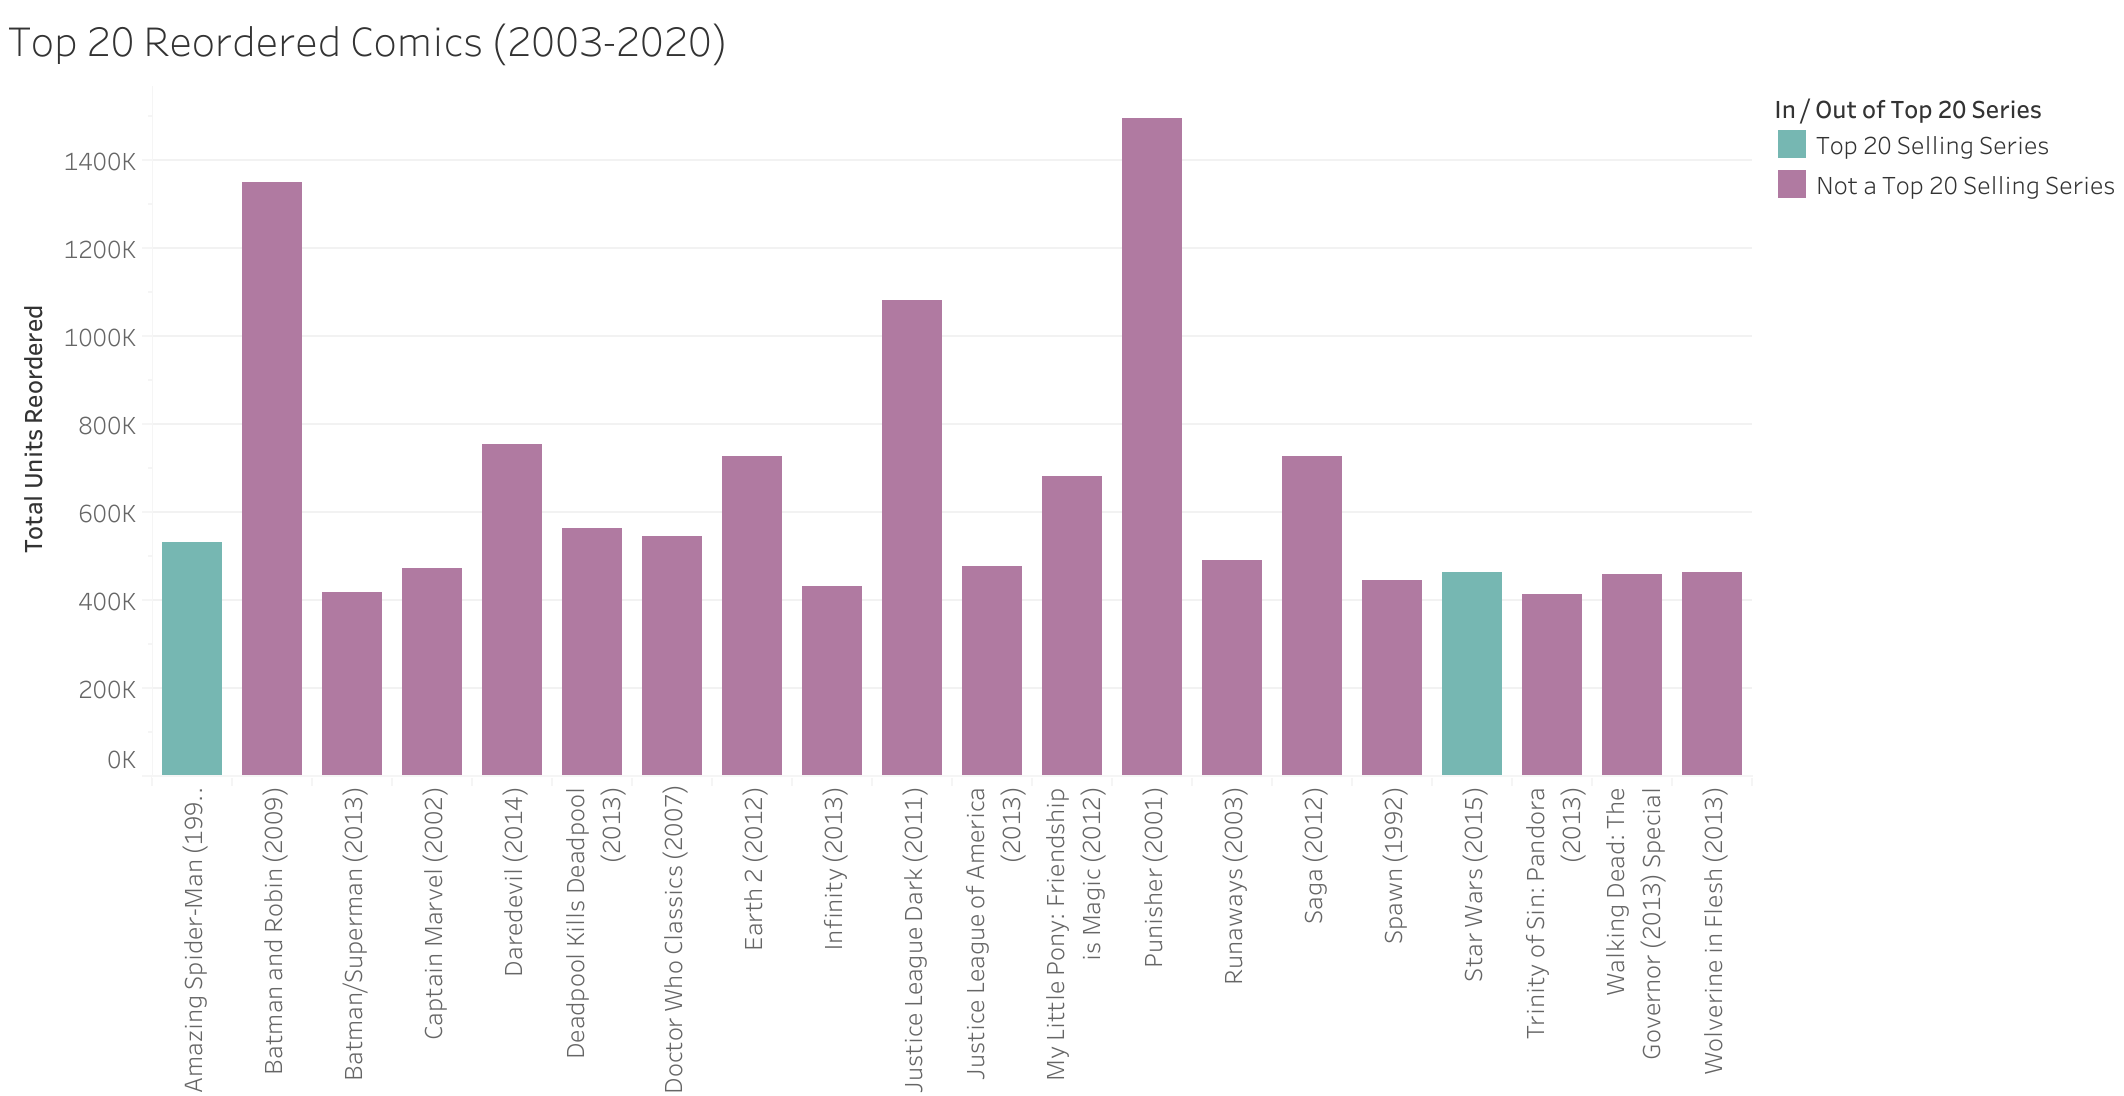
While it is no surprise that 7 of the 20 top selling series feature Batman, none of these series are in the top 20 for reordered issues. In fact only two series: Amazing Spider-Man (1999) and Star Wars (2015) are in both top 20 lists. This shows that although inital readership of the top series is high, these are not stories that people continue to return to over time or new readers are seeking out. The top 20 reordered series list features more niche IPs like Saga, Doctor Who, and My Little Pony. Another interesting point from the top 20 series is the huge difference between Batman (2011) and the Walking Dead (2003). While both series generated similar overall revenue ($30,047,268 for Batman versus $31,134,923 for Walking Dead), Batman generated this revenue across only 57 issues, while the Walking Dead took 192.
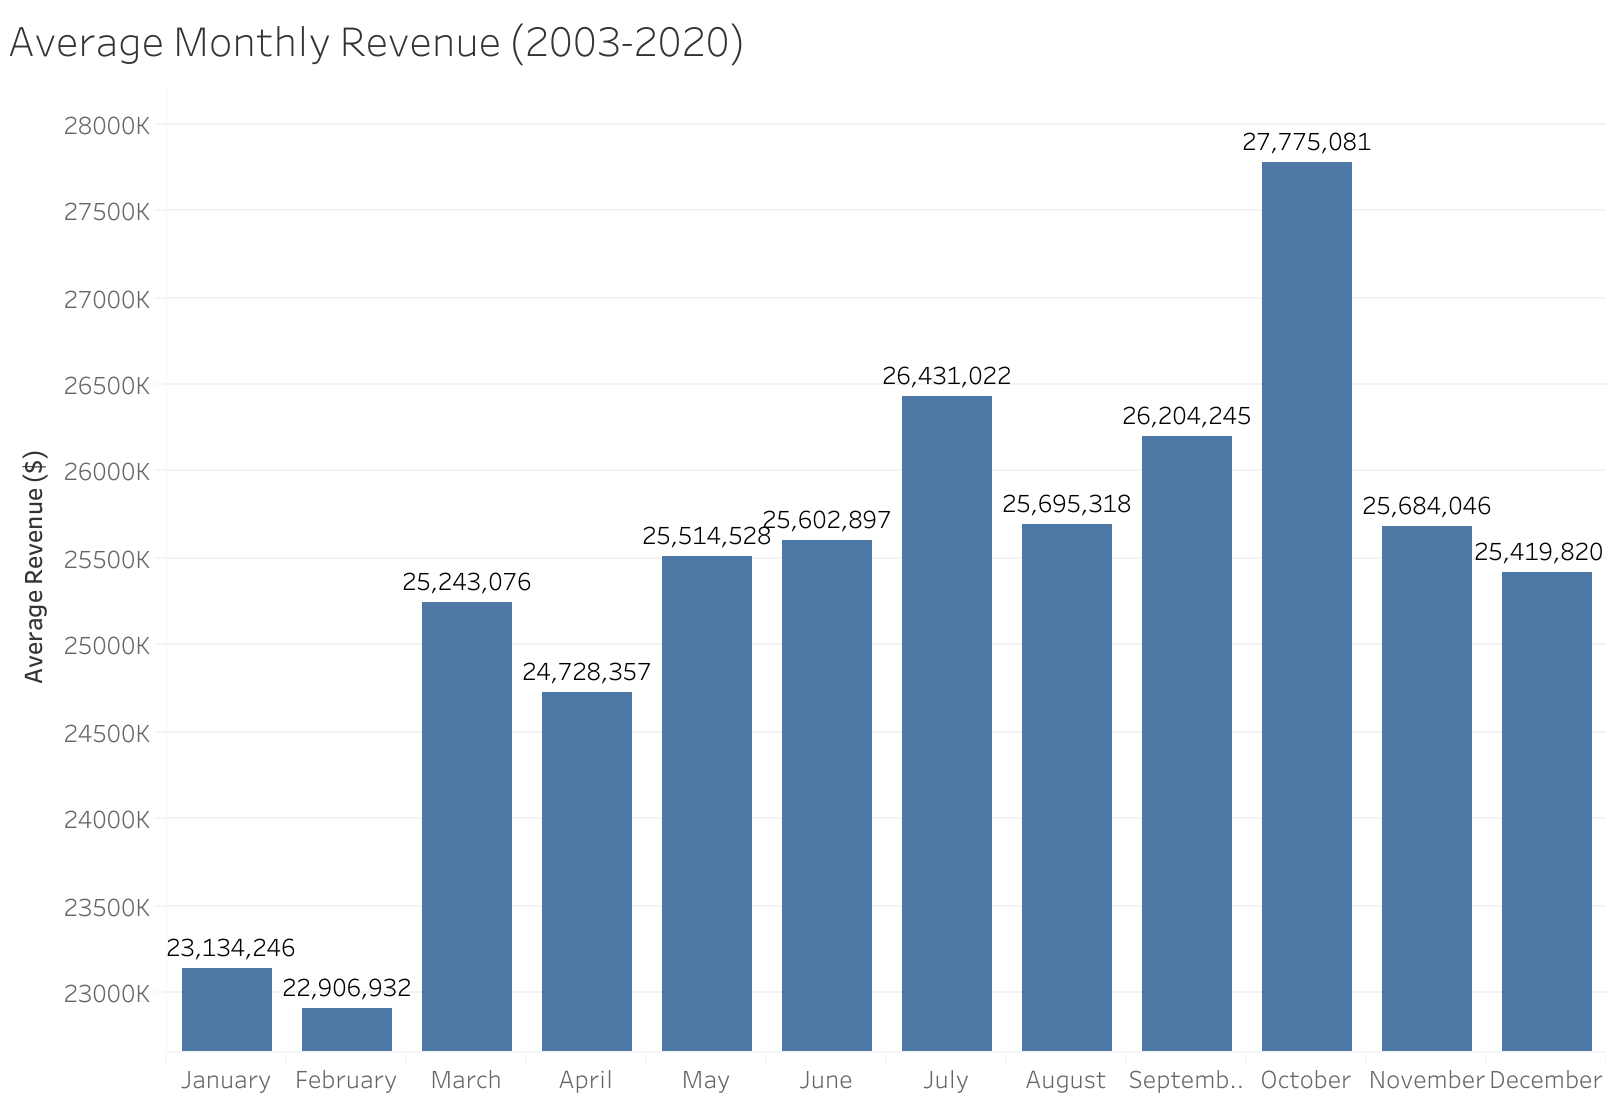
This last graph surprised me the most. This graph shows the average monthly revenue across all publishers for each month. While there was an expected dip in sales at the beginning of the year, I was surprised to see October as the most lucrative month. I expected November or December--"holiday season"--to be the height of sales. My best guess is that publishers tend to release large Events and major titles in October in anticipation of holiday shopping. While this graph shows dramatic differences between months, there is overall only about a $5 million fluctuation.
Marvel & Twitter API Integration
After creating my data visualizations, I wanted to try working with an API. Marvel offers an API to access information about their published comics as well as their characters, storylines, and other IPs. In addition to working with the API, I also ended up working with several new Python libraries for this portion of the project: including openpyxl, time, hashlib, and glob. The Marvel API requires both a hashed api key as well as a timestamp in order to make requests. Due to incompleteness in the API, some item could easily be found by their unique Diamond Code but many comics did not have this information filled out in the API. Instead, comics had to be found by searching their title and issue number. In some cases the year also had to be consulted (as there are several "Spider-Man #1" comics).
Each Twitter post contains the title and significance of the issue as well as a cover image and link to the issue on marvel.com. Ideally the tweet would also contain information about the creative team behind the issue, but often this overflows Twitter's 280 character limit. The associated Twitter account can be found @pfch_marvel.
API Difficulties
The Marvel API's Interactive Documentation was really useful when troubleshooting queries to the API as well as becoming familiar with the returned results. However, it was frustrating that titles had to be exact matches (or "starts with" exact matches), so if a period or hyphen was missing the issue would not be returned by the API. However, there were only a handful of issues that could not be found by the Marvel API at all. It was also annoying that the API did not accept multiple search terms for each field (did not support an OR operator).
Project Conclusion
Working with APIs and learning their quirks and structure was definitely the hardest part of this project. It was also tricky to work with so many new Python libraries for the API portion of my project. I worked very piecemeal on this project, creating a python file for each step of the process. I think eventually some of these pieces could be combined into a single step. Ideally I would like to make my Twitter integration into a full Twitter Bot, but I did not have time to complete this step. I learned a lot about my topic from looking at so much data that I couldn't process without Python. I also learned a lot about Python programming, and was excited to try using a lot of different formats and techniques in this project.
About This Project
This project was completed as the final assignment for INFO-664 (Programming For Cultural Heritage) at the Pratt Institute during the Spring 2021 semester. I chose to look at the comic book industry, because I enjoy reading comic books and the industry has gone through many changes in the past few decades. As a niche hobby, it is very beneficial to know how the industry works in order to better understand the challenges the market faces. For this project I used Python for all of the coding and Tableau to create the data visualizations.